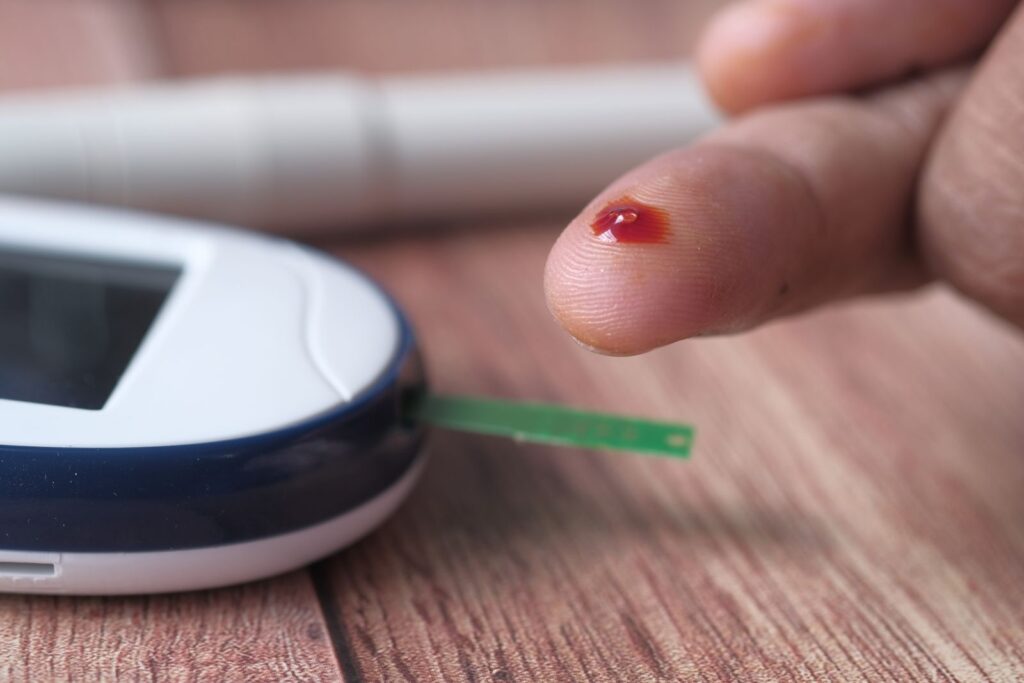
An A1C result comes back as a percentage — say, 5.9% — which doesn’t mean much on its own unless you already know the reference ranges by heart. Converting it to an estimated average glucose (eAG) number, in the same mg/dL units as a home glucose meter, often makes the result click in a way the percentage alone doesn’t.
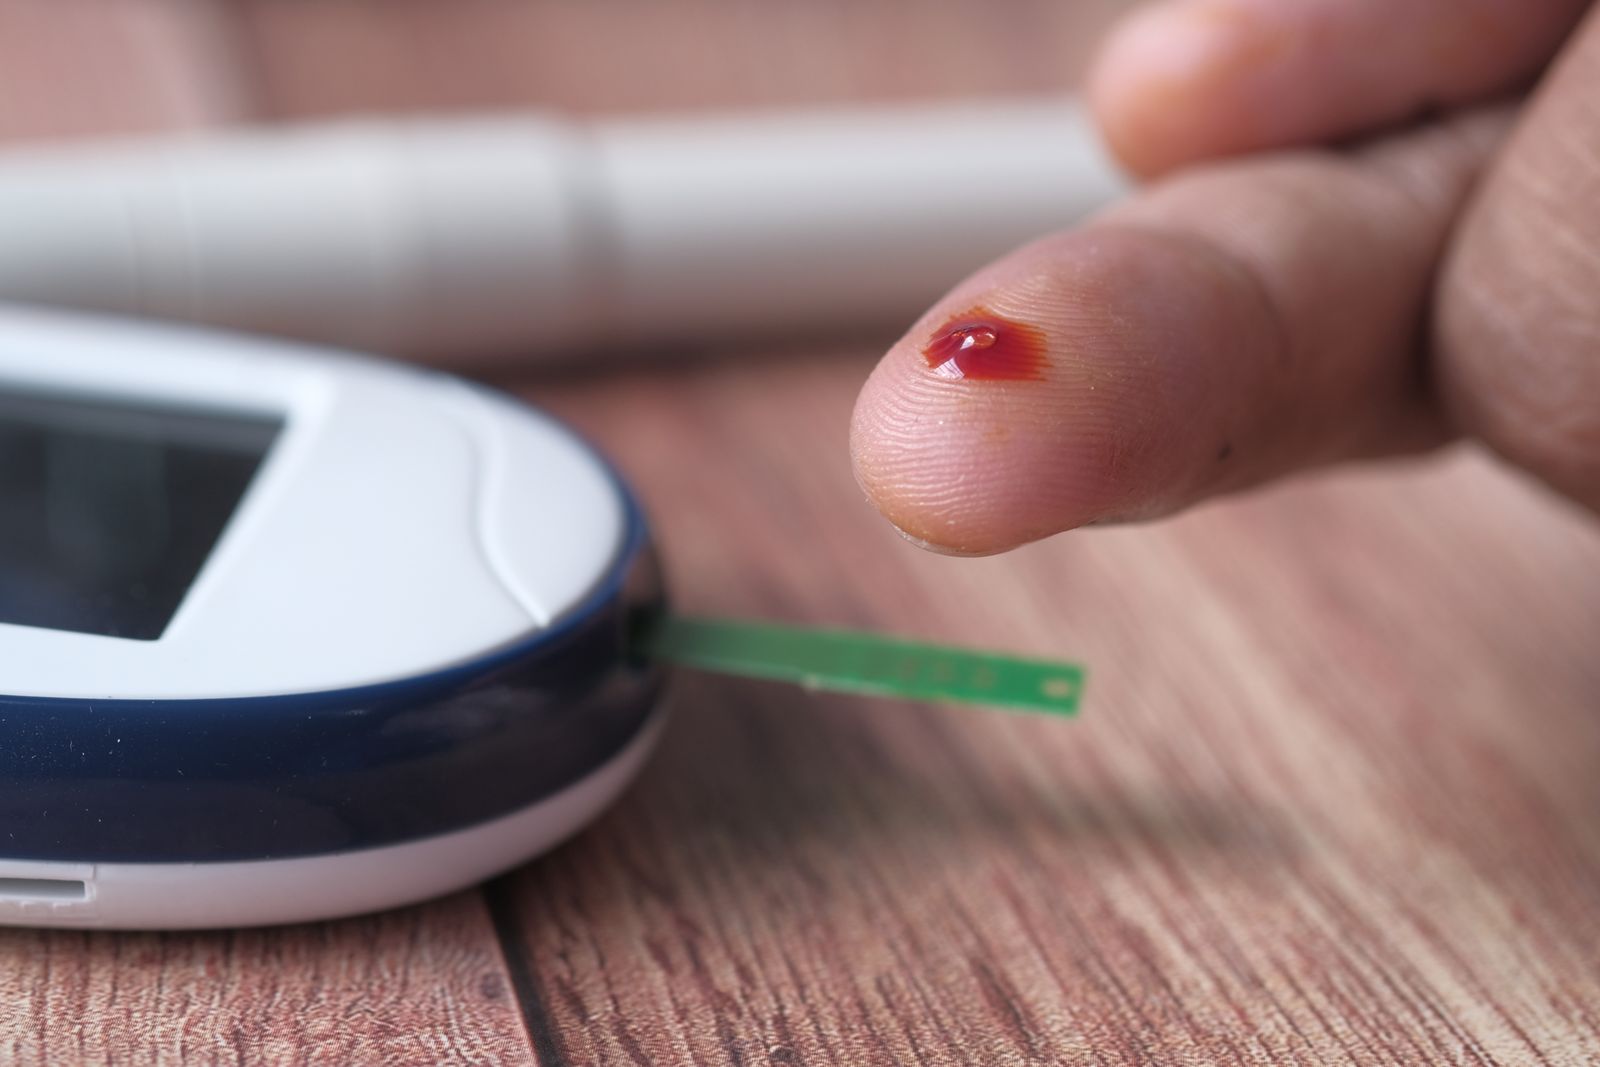
Convert A1C to Estimated Average Glucose
A1C to Average Glucose Converter
Based on the ADAG (A1c-Derived Average Glucose) study formula. This is an estimate of average glucose over roughly the past 3 months, not a moment-in-time reading like a finger-stick test.
What A1C Actually Measures
A1C (hemoglobin A1c) measures the percentage of hemoglobin proteins in red blood cells that have glucose attached to them. Because red blood cells live for roughly 2-3 months, A1C reflects average blood sugar over that period rather than a single moment, which is what makes it useful for assessing longer-term glucose control rather than day-to-day fluctuations.
ADA Reference Ranges for A1C
- Below 5.7%: normal range
- 5.7% to 6.4%: prediabetes range
- 6.5% or above: diabetes range (typically confirmed with a repeat test)
Frequently Asked Questions
Why doesn’t my meter’s average match my A1C-estimated average? Differences in when and how often you test, along with individual variation in how glucose binds to hemoglobin, can cause some discrepancy between a home meter’s logged average and the A1C-derived estimate; both provide useful but slightly different information.
Can certain conditions affect A1C accuracy? Yes — conditions affecting red blood cell lifespan (like certain anemias or recent blood loss) can skew A1C results independent of actual glucose levels, which is something a doctor accounts for when interpreting results.
What A1C Is Actually Measuring
Unlike a fasting glucose test, which captures a single moment, A1C measures the percentage of your hemoglobin (the protein in red blood cells that carries oxygen) that has glucose attached to it. Because red blood cells live for roughly three months, A1C gives a rolling average of blood sugar exposure over that period, weighted more heavily toward the most recent 30 days. That’s why converting A1C to an “estimated average glucose” is useful: it translates a percentage that’s hard to intuit into a number in the same units you’d see on a glucose meter, making it easier to understand what your day-to-day readings have likely looked like on average.
It’s worth being clear about what this estimate can’t do. It smooths out the peaks and valleys, so two people with the same A1C can have very different glucose patterns; one might run steady all day, while the other swings widely between highs after meals and lows in between. A1C also can’t tell you when those swings happened. For that level of detail, home monitoring or continuous glucose monitoring is needed alongside the lab-drawn A1C.
Situations Where A1C Can Be Misleading
A1C relies on the assumption that red blood cells live a normal lifespan and behave typically, which isn’t always true. Conditions that affect red blood cell turnover, including certain anemias, recent significant blood loss, pregnancy, and some chronic kidney or liver conditions, can push the A1C result higher or lower than your actual average glucose would suggest. This is one of the main reasons doctors don’t rely on A1C alone for diagnosis or monitoring in every situation, and why unexpected A1C results are usually followed up with additional testing rather than taken at face value.
If your converted average glucose number doesn’t match what your home meter has been showing, that mismatch itself is useful information to bring to a doctor, rather than something to resolve by trusting one number over the other.
How Often A1C Should Be Checked
For people without diabetes, A1C is typically checked as part of routine screening every one to three years depending on risk factors like weight, family history, and age. For people managing prediabetes or diabetes, testing every three to six months is common, since that interval roughly matches the three-month window the test reflects and gives enough time for a change in diet, activity, or medication to show up in the result. Testing more frequently than that usually doesn’t add useful information, because A1C moves slowly by design.
This converter is meant to make a single lab report easier to interpret in familiar terms, not to replace the conversation with whoever ordered the test. Bring the actual percentage and the converted estimate to that appointment, since your provider will weigh it alongside your history, medications, and any other lab values rather than in isolation.
One more nuance worth knowing: A1C results can differ slightly between certain racial and ethnic groups for reasons unrelated to actual average glucose, which is another reason it’s interpreted by a clinician alongside your broader health picture rather than as a standalone cutoff.
Sources
- Nathan DM, et al. — Translating the A1C Assay into Estimated Average Glucose (Diabetes Care, 2008)
- CDC — A1C Test and Diabetes
- American Diabetes Association
- CDC (Centers for Disease Control and Prevention)
Final Thoughts
Converting A1C to an average glucose number can make lab results feel more concrete, especially if you’re used to reading a home meter in mg/dL. It’s an estimate of a 2-3 month average, not a substitute for the A1C test or a doctor’s interpretation of your full results.
This article is for general educational purposes and is not a substitute for personalized medical advice.
About the Author
This article was written and reviewed by Drxty Editorial Team, focused on translating public health information into clear, practical guidance for everyday readers. If you spot an error or have a correction, please contact us.