
An annual physical often includes a panel of blood tests, and the results usually arrive as a page of abbreviations and numbers with little explanation. Understanding the basics of what these markers measure will not replace a conversation with a doctor, but it can make that conversation more useful, since the patient will know what questions to ask instead of just skimming past unfamiliar terms.
Blood pressure is another simple number worth tracking alongside your labs — see our guide on understanding your blood pressure numbers for what the two figures actually mean.
Complete Blood Count (CBC)
The CBC looks at the cells that make up blood: red blood cells, white blood cells, and platelets. Red blood cell measures, including hemoglobin and hematocrit, relate to how well blood is carrying oxygen, and low values can point toward anemia. White blood cell counts relate to immune function and can rise in response to infection or inflammation. Platelet counts relate to blood clotting. A single abnormal value on a CBC is common and often not significant on its own, particularly if it is only slightly outside the reference range, but a pattern of several abnormal values together is something a doctor will look at more closely.
Comprehensive Metabolic Panel (CMP)
This panel covers blood sugar (glucose), kidney function markers like creatinine and BUN, liver enzymes, and electrolytes such as sodium and potassium. Fasting glucose is one of the more commonly discussed values, since consistently elevated levels are one of the markers used in screening for prediabetes and diabetes. Kidney and liver markers give a general sense of how those organs are functioning, though a single test in isolation is usually just a starting point rather than a diagnosis, especially since factors like hydration, recent meals, and medications can all temporarily affect these numbers.
Lipid Panel
The lipid panel measures total cholesterol, LDL (often called bad cholesterol), HDL (often called good cholesterol), and triglycerides. These markers are used, alongside other risk factors like blood pressure, family history, and smoking status, to estimate cardiovascular risk over time. It is worth noting that cholesterol numbers are interpreted differently depending on the overall risk profile of the individual, which is why a number that looks concerning in isolation might be considered acceptable for one person and worth addressing for another. This is a conversation better had with a doctor than settled by comparing numbers to a generic chart.
Thyroid Panel
Thyroid function is usually screened with a TSH (thyroid-stimulating hormone) test, sometimes alongside free T4. TSH tends to move in the opposite direction of thyroid hormone levels: a high TSH often suggests an underactive thyroid, while a low TSH often suggests an overactive one. Thyroid symptoms, fatigue, weight changes, temperature sensitivity, overlap heavily with many other conditions, so a blood test is a much more reliable way to evaluate thyroid function than symptoms alone.
Making Sense of the Reference Ranges

Every value on a lab report comes with a reference range, and it is easy to treat anything outside that range as automatically abnormal. In reality, reference ranges are typically built to cover the middle 95 percent of a healthy population, which means roughly 1 in 20 healthy people will have at least one value slightly outside the range purely by statistical chance, with nothing wrong. Ranges can also vary slightly between labs depending on the equipment and methods used, which is one reason it helps to have bloodwork done at the same lab over time for consistent tracking.
Preparing for a Blood Draw
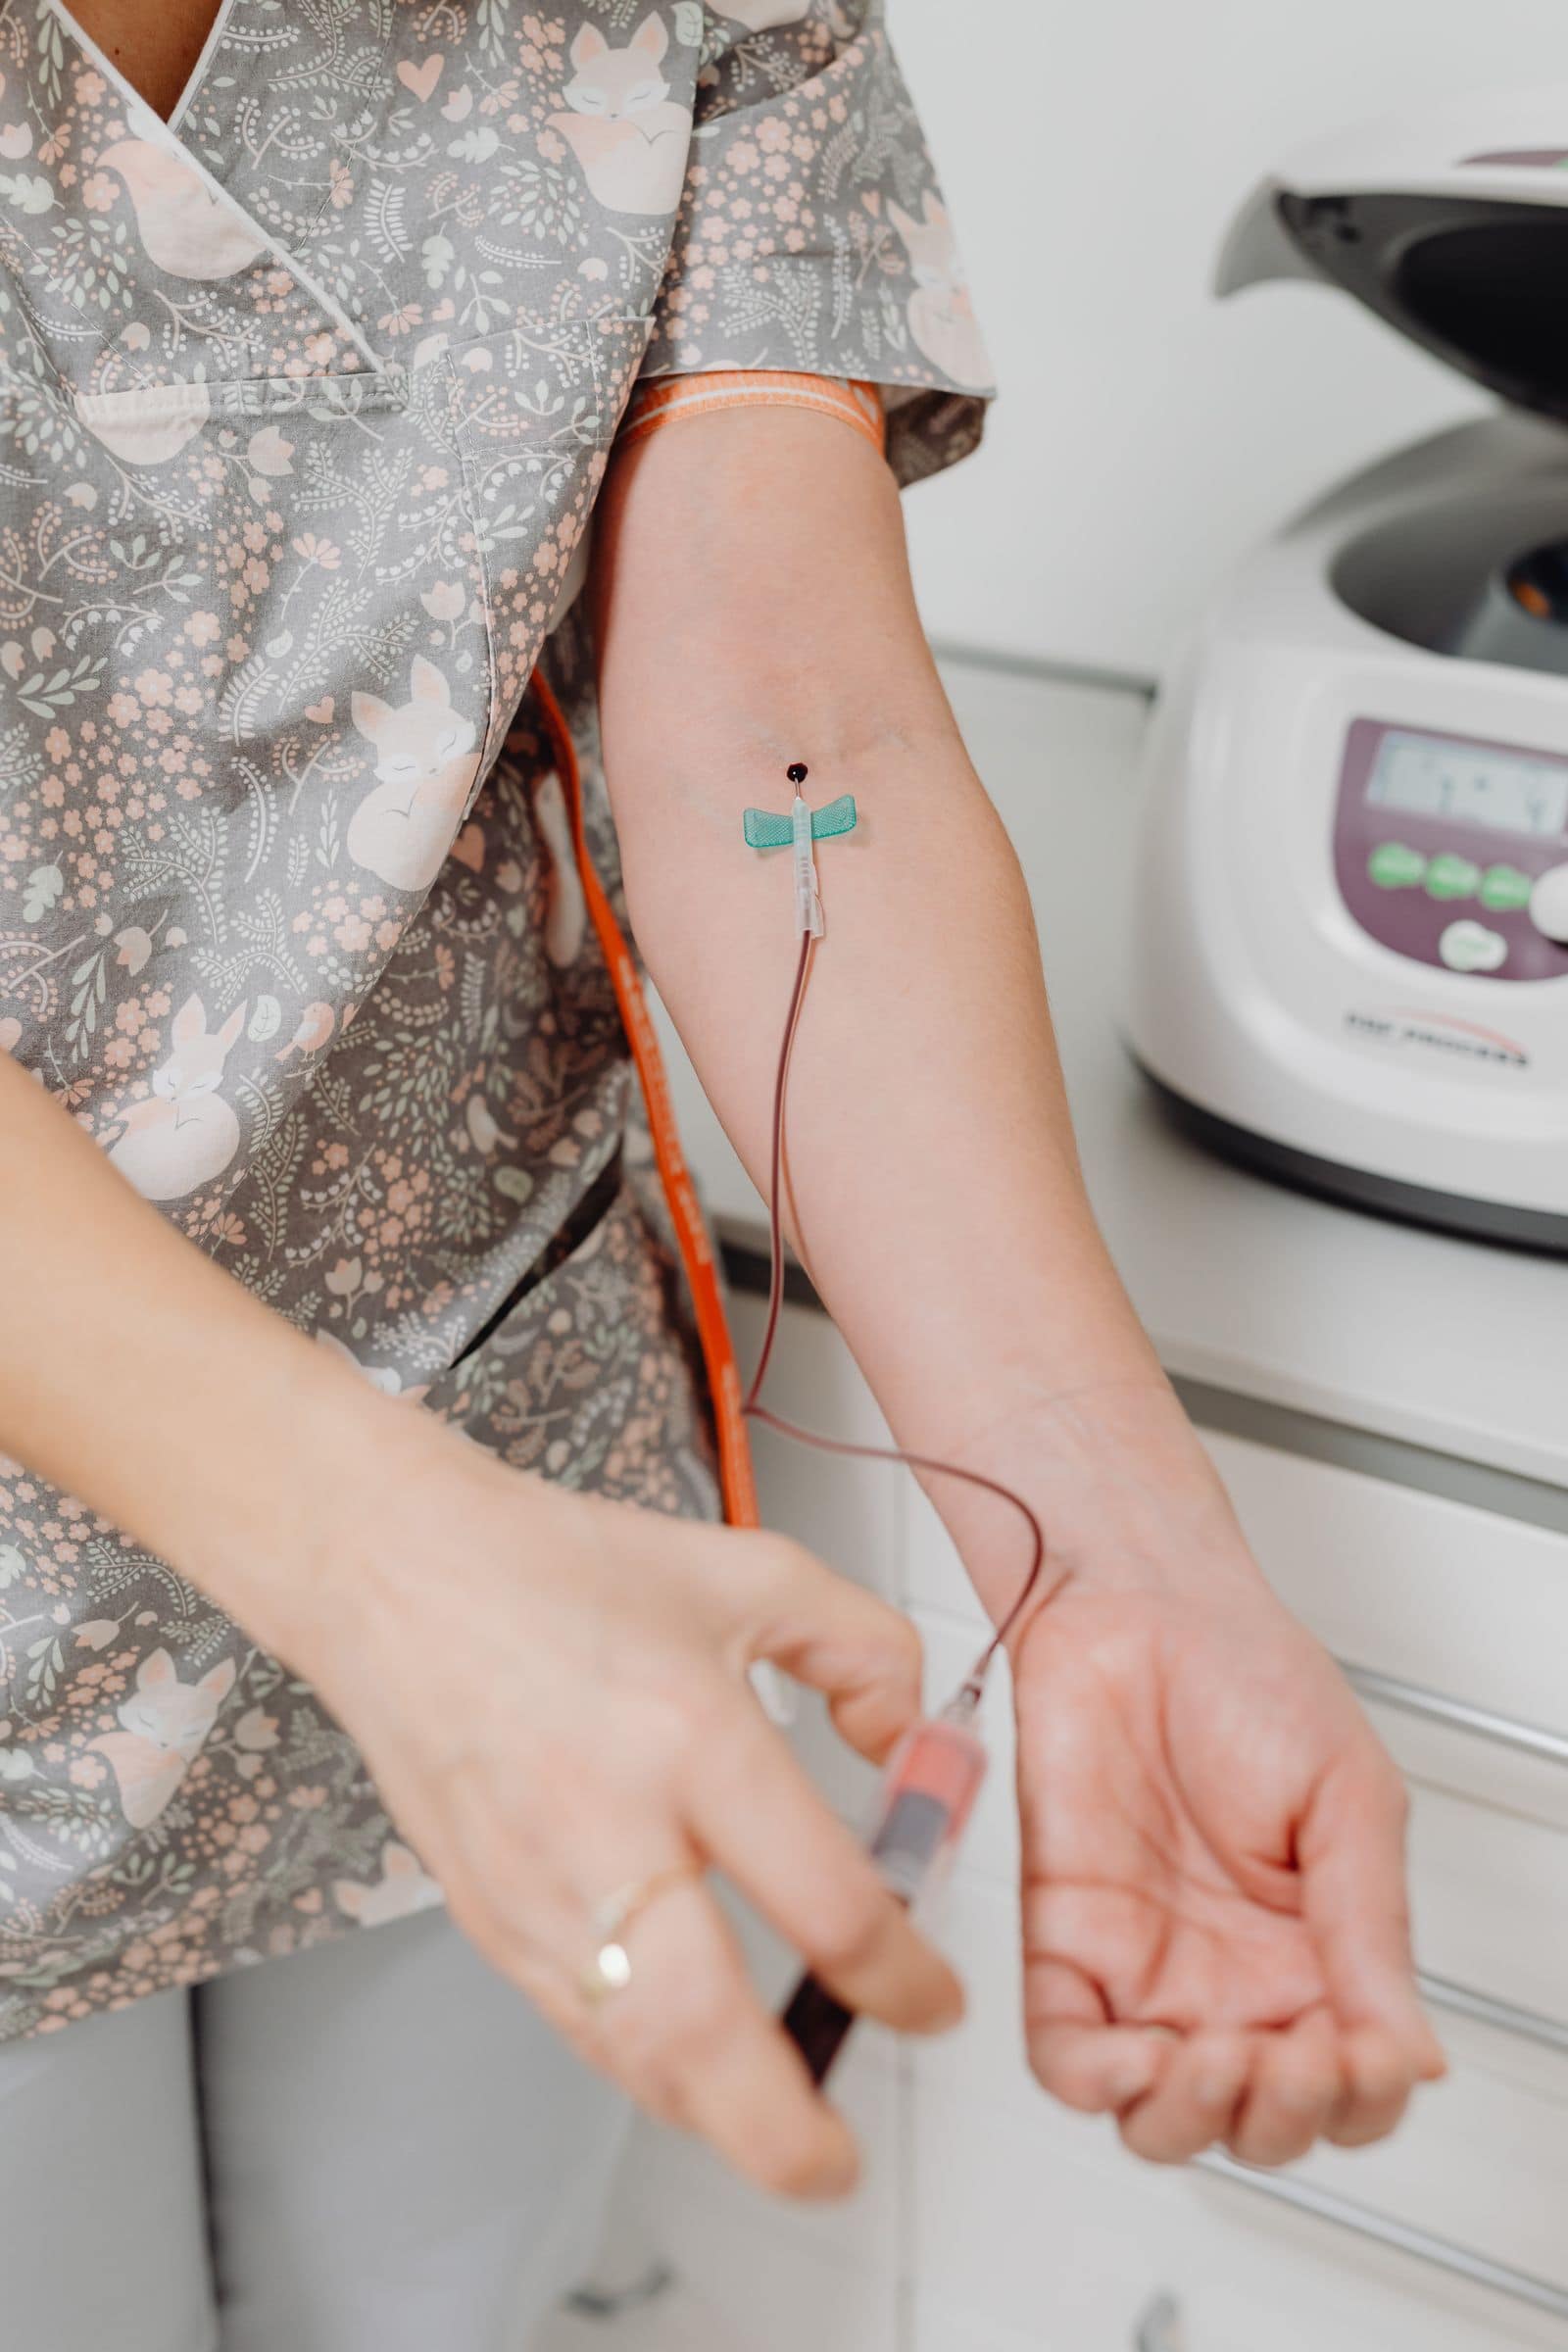
Some blood tests, particularly glucose and lipid panels, require fasting for around 8 to 12 hours beforehand, since recent food intake can temporarily raise blood sugar and triglyceride levels and make results harder to interpret. Water is generally fine during a fasting window, but it is worth confirming with the lab or clinic beforehand, since instructions can vary slightly depending on which specific tests are ordered.
Hydration, recent exercise, alcohol, and even the time of day can all shift certain values slightly, which is part of why doctors often recommend having routine bloodwork done under similar conditions each time, for example in the morning before eating, to make results more comparable from one year to the next.
It is easy to open a patient portal, see a single value highlighted in red or yellow, and assume the worst before reading a word of context. Most of the time that flagged value is only slightly outside the lab’s reference range, which is itself built from a statistical average rather than a hard medical threshold. A number just outside the line is a reason to ask a question at the next appointment, not a reason to spend the evening searching symptoms online.
When to Follow Up Sooner Than the Next Annual Visit
Most routine results, even mildly abnormal ones, are addressed at the next scheduled visit or with simple lifestyle guidance. Certain results, however, are flagged by labs and doctors for faster follow-up: significantly elevated glucose that could indicate undiagnosed diabetes, very abnormal kidney or liver markers, or blood counts far outside expected ranges. If a doctor or the lab reaches out proactively about a result, that is generally a sign it is worth prioritizing that follow-up rather than waiting.
The most useful way to think about routine bloodwork is as a trend over years rather than a single verdict from one visit. A value that is stable over time, even if slightly outside the standard range, often carries less concern than a value that is moving sharply in one direction. Any result that is confusing, or any that raises concern, is worth asking a doctor to walk through directly, since a doctor has the full context of a patient health history that a general explanation like this one cannot account for.
Why Context Matters More Than Any Single Marker
Reading bloodwork by scanning for values flagged as “high” or “low” against a reference range is a common but limited approach, since reference ranges represent a statistical range covering most of a healthy population, not a personalized target, and a single marker slightly outside that range isn’t automatically clinically significant on its own, particularly for markers that naturally fluctuate based on recent food intake, hydration, time of day, or minor, temporary illness. More meaningful interpretation generally comes from looking at patterns across related markers together, and comparing your current results against your own previous results over time, rather than treating each individual number as an isolated data point measured only against a general population range.
This is part of why the same lab report can mean different things for different people, someone with a family history of a specific condition, or other risk factors, may warrant closer attention to a borderline value that would be less concerning in someone without those risk factors, context a general reference range simply can’t capture on its own.
Common Marker Categories Worth Understanding
A standard annual panel typically includes several categories working together: a complete blood count (CBC), assessing red and white blood cells and platelets, useful for detecting anemia, infection, or certain blood disorders; a metabolic panel, covering blood sugar, kidney function markers (creatinine, BUN), electrolytes, and liver enzymes, giving a broad snapshot of several organ systems at once; a lipid panel, covering cholesterol and triglycerides for cardiovascular risk assessment; and depending on age, sex, and individual risk factors, additional markers like thyroid function (TSH), vitamin D, and inflammatory markers may be included. Each category reflects a different physiological system, which is why a comprehensive picture, rather than fixating on one flagged value, generally gives a more accurate read on overall health status.
Trends across multiple years of annual bloodwork are often more informative than any single year’s results in isolation, a marker gradually drifting toward the edge of a normal range over several consecutive years can be a meaningful early signal worth addressing, even while each individual year’s result technically remained within the “normal” reference range.
Making the Most of a Results Conversation
Rather than trying to fully interpret bloodwork independently from general reference ranges found online, bringing specific questions about any flagged values, and asking how your current results compare to your own previous years, to your doctor’s appointment tends to produce a far more useful and personalized conversation than self-diagnosing from a printed lab report alone. If a result is genuinely concerning, your doctor will typically recommend either repeat testing to confirm a pattern, or additional, more specific testing to investigate further, rather than making a diagnosis from a single annual panel value in isolation.
For blood sugar specifically, our blood sugar basics guide covers the normal, prediabetes, and diabetes ranges in more depth.
